
What Is AI Spend Classification?
Short answer
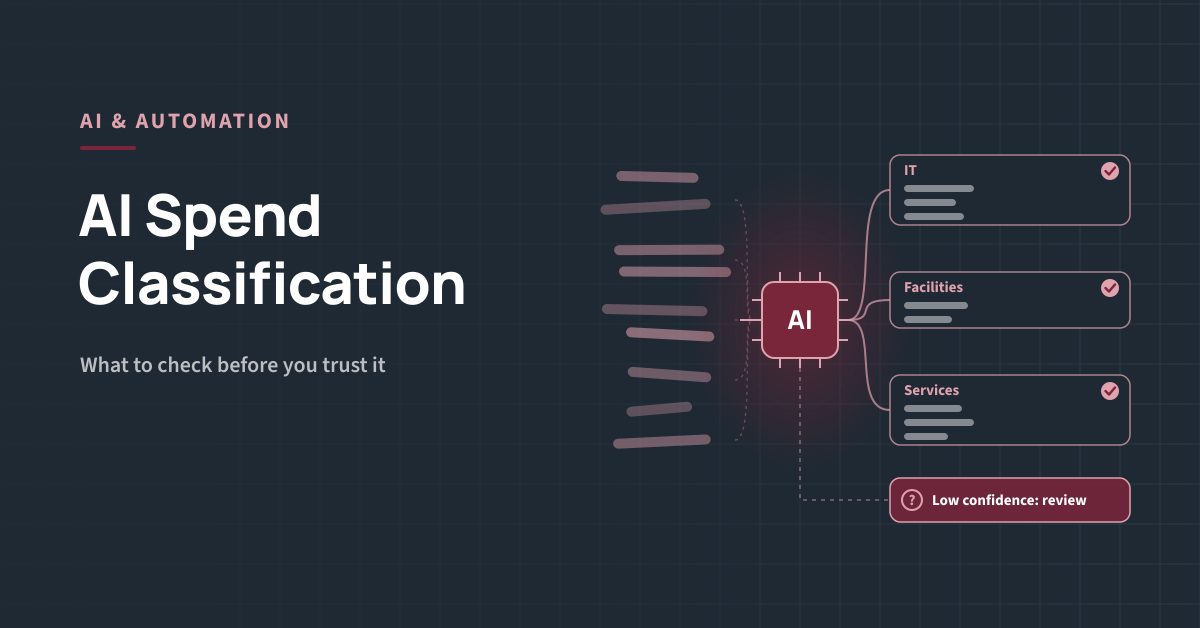
AI spend classification uses machine learning and language models to assign every transaction, from invoices, purchase orders, card statements and expenses, to a category in a spend taxonomy. It also cleans and merges supplier names, scores how confident it is in each result, and sends uncertain lines to people for review.
Key Takeaways
-
- Classification is the foundation for tail spend visibility, segmentation, KPIs and any later automation.
-
- Most modern tools combine rules, machine learning and language models rather than relying on one method.
-
- Headline accuracy can hide poor results in the tail, where suppliers are small, rare and vaguely described.
-
- Test on your own data, measure accuracy by spend and by line count, and check the depth of classification.
-
- Classification needs an owner, a review queue and a regular refresh, not a one-off clean-up.
Why Classification Matters for Tail Spend
Tail spend is spread across many suppliers, cost centres and payment routes, often with inconsistent supplier names and no category codes. Without classification, you cannot answer basic questions: how much you spend on IT accessories, how many suppliers provide cleaning services, or which categories are worth moving to a catalogue. Step 2 of our 6-step tail spend strategy framework depends on it, and so does every segment, channel decision and KPI that follows. Classification also comes first for automation. Intake routing, autonomous sourcing and AI agents all rely on clean categories and supplier data. Our guide to AI in tail spend management lists it as one of the most established use cases for exactly this reason.How AI Spend Classification Works
-
- Collect the data. Pull transactions from accounts payable, purchase orders, P-card statements, expense claims and marketplace accounts.
-
- Clean and merge suppliers. Match variants such as “ABC Ltd”, “ABC Limited” and “ABC UK” to one supplier record.
-
- Enrich. Add information about each supplier, such as its industry, to help classify lines with vague descriptions.
-
- Classify. Assign each line to a category, using rules for known suppliers and models that read the description, supplier and amount.
-
- Score confidence. Give each result a confidence score, so certain lines go straight through and uncertain ones are flagged.
-
- Review. People check low-confidence lines and correct errors.
-
- Learn and refresh. Corrections feed back into the model, and new transactions are classified on a regular cycle.
The Main Approaches Compared
Choosing a Taxonomy
Classification is only as useful as the taxonomy behind it. You have two main choices:-
- A standard taxonomy, such as UNSPSC, which is widely recognised and detailed, but can be more granular than finance and budget holders need.
-
- A custom taxonomy built around your own categories, which is easier for the business to read, but harder to compare with external data.
-
- A mapped approach, classifying to a standard and mapping to your own top levels, which many organisations use to get both.
What to Check Before You Trust It
Run these checks during a pilot or proof of concept, using your own data rather than a vendor demo set.How to Run a Simple Accuracy Test
-
- Choose a period. Use the last 12 months of spend from all payment routes.
-
- Draw two samples. One random sample across all spend, and one focused on low-spend, infrequent suppliers.
-
- Review by hand. Ask category experts to mark each sampled line as correct or incorrect at every taxonomy level.
-
- Calculate accuracy. Report results by line count and weighted by spend, for each sample and level.
-
- Look at the errors. Note patterns, such as particular suppliers, categories or payment routes, and ask how the tool would fix them.
-
- Repeat after corrections. Re-test once corrections have been applied to see whether the tool learns.
Common Pitfalls
-
- Trusting one headline number. A single overall accuracy figure can look strong while the tail is poorly classified.
-
- Over-detailed taxonomies. Hundreds of categories nobody uses make results harder to read and to check.
-
- No owner. Without someone responsible for the taxonomy and review queue, quality drifts.
-
- One-off clean-ups. New suppliers and descriptions arrive every month. Classification must run continuously.
-
- Ignoring card and expense data. Much tail spend sits outside purchase orders and invoices.
Measuring Classification Quality Over Time
Questions to Ask Vendors
-
- Can we test the tool on our own data before we buy?
-
- How do you report accuracy, and can you show it by spend, by line count and by taxonomy level?
-
- How do you handle low-spend, infrequent suppliers with vague descriptions?
-
- Does every result have a confidence score, and how do low-confidence lines reach a reviewer?
-
- Can you show why a line was placed in a category?
-
- How quickly do our corrections improve future results?
-
- Where is our data stored, and is it used to train models for other customers?
Next step
Find tools that fit your data. The Vendor Fit Finder matches your requirements to the solution types worth evaluating, and our guide to tail spend software explains what spend analytics platforms typically cover.