A tail spend programme is easy to start and hard to prove. New channels go live, policies are written and tools are switched on, but six months later someone asks whether any of it is working. Without the right measures, the answer is a collection of anecdotes.
This guide sets out the KPIs that show whether your tail spend programme is working, how to calculate each one, where the data comes from, and how to set targets that drive the right behaviour. It expands on Step 6 of our
6-step tail spend strategy framework.
What Are Tail Spend KPIs?
Short answer
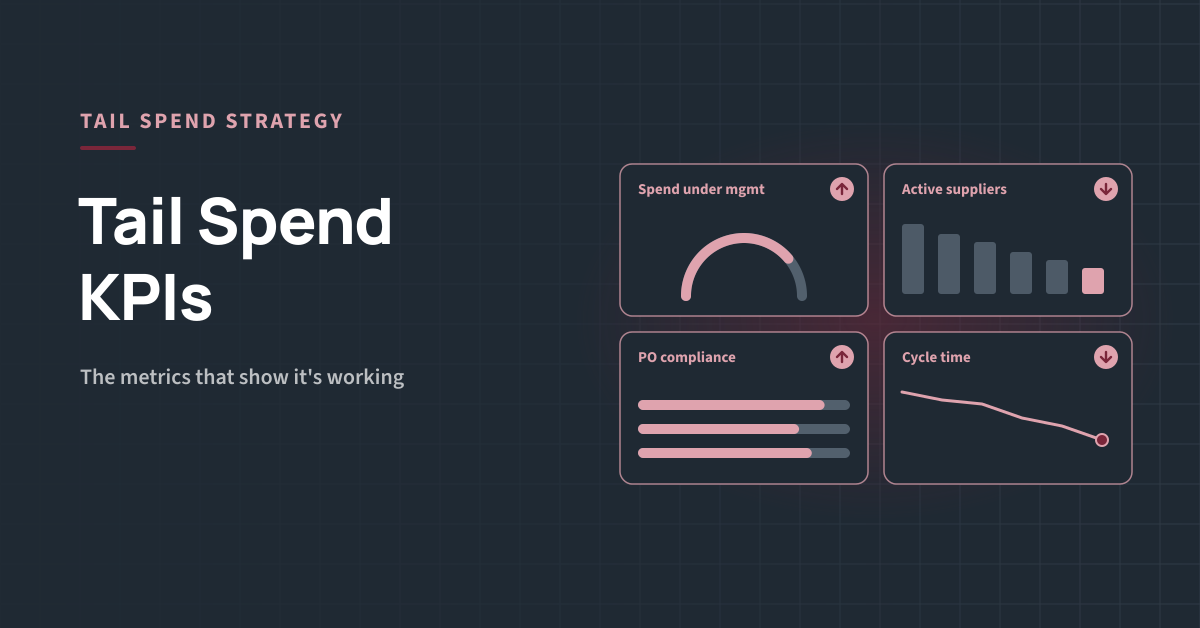
Tail spend KPIs are the measures that show whether low-value, high-volume spend is visible, controlled and efficient. The core set covers spend under management, active supplier count, PO compliance and request-to-order cycle time, supported by measures of cost, value, risk and the requester experience.
Key Takeaways
-
- Measure tail spend separately from strategic spend, or strategic results will hide what happens in the tail.
-
- Start with four core KPIs: spend under management, active supplier count, PO compliance and cycle time.
-
- Record a baseline before you change anything, and set targets as improvements on your own starting point.
-
- Read KPIs together. Better control that makes buying slower usually pushes people back to workarounds.
-
- Different audiences need different views: procurement monthly, finance and leadership quarterly.
Why Measure the Tail Separately
Most procurement scorecards are built around strategic spend: savings on big contracts, supplier performance on key accounts. Tail spend behaves differently. Its value is spread across many small purchases, its costs are mostly process and supplier upkeep, and its risks sit in suppliers nobody checked. If you do not define the tail and measure it on its own, its results disappear into the totals. Our guide to
what tail spend is explains how to define it.
The KPI Framework at a Glance
| Area |
KPI |
What it shows |
| Visibility |
Share of spend classified |
How much of your spend you can actually see |
| Control |
Spend under management |
How much tail spend goes through approved channels |
| Control |
PO compliance |
Whether purchases follow the agreed process |
| Supplier base |
Active tail supplier count |
Whether the supplier list is shrinking |
| Supplier base |
New suppliers added per month |
Whether supplier growth is under control |
| Efficiency |
Request-to-order cycle time |
Whether buying is fast enough to stop workarounds |
| Efficiency |
Cost per purchase order |
What each purchase costs to process |
| Efficiency |
Card share of eligible transactions |
Whether low-value buys use the cheapest channel |
| Value |
Spot buys with competing quotes |
Whether one-off buys are fairly priced |
| Risk |
Active suppliers with completed checks |
Whether tail suppliers meet your due diligence standard |
| Experience |
Requester satisfaction |
Whether people prefer the approved route |
The Four Core KPIs
If you track nothing else, track these four. Together they show visibility, control, supplier growth and speed.
1. Spend under management
Spend under management = Tail spend through approved channels ÷ Total tail spend
Approved channels are the ones your strategy defines: catalogues, preferred suppliers, P-cards within policy, spot-buy processes and managed services. This is usually the headline KPI for a tail programme, because it shows how much of the tail you have actually brought under control.
2. Active tail supplier count
Active tail suppliers = Suppliers paid in the last 12 months that fall within your tail definition
A falling count shows that recurring spend is consolidating. Track new suppliers added per month alongside it, because a stable total can hide a high churn of one-off suppliers.
3. PO compliance
PO compliance = Tail invoices with a matching purchase order ÷ Total tail invoices
Exclude agreed exceptions, such as utilities or card spend.
Low PO compliance means purchases are being made first and paperwork follows later, which is when price leakage and unchecked suppliers appear.
4. Request-to-order cycle time
Cycle time = Average time from request submitted to order placed
Speed is the KPI most programmes forget. If the approved route is slow, people stop using it. An
intake-to-procure front door makes cycle time easier to measure, because every request has a start time.
Supporting KPIs: How to Calculate Them
| KPI |
How to calculate |
Data source |
Good direction |
| Share of spend classified |
Classified spend ÷ total spend |
Spend analytics or classification tool |
Up |
| New suppliers added per month |
Count of new tail supplier records created |
Supplier master data |
Down, or stable |
| Cost per purchase order |
Process cost ÷ number of POs |
Process data and finance records |
Down |
| Card share of eligible transactions |
Card transactions ÷ eligible low-value transactions |
Card and AP data |
Up, within policy |
| Spot buys with competing quotes |
Spot buys with two or more quotes ÷ all spot buys above the quote threshold |
Sourcing or intake records |
Up |
| Suppliers with completed checks |
Active tail suppliers with due diligence complete ÷ all active tail suppliers |
Supplier onboarding records |
Up |
| Requester satisfaction |
Short survey after a request is fulfilled |
Intake tool or survey |
Up |
For the detailed method behind cost per PO, see our guide to
calculating cost per purchase order. For card measures, see
P-card policy for tail spend, and for quote measures,
spot buying explained.
How to Set Targets
-
- Baseline first. Measure every KPI for at least one period before any changes, using the same tail definition you will use later.
-
- Set direction before numbers. Agree which way each KPI should move, then set realistic steps from your own starting point.
-
- Keep definitions fixed. If you change the tail threshold or channel list, restate the baseline so results stay comparable.
-
- Pair control with speed. Set a cycle time target alongside every control target, so tighter rules do not create friction.
-
- Avoid gaming. A target on PO compliance alone can lead to POs raised after the invoice. Check how results are achieved, not just the number.
Read KPIs Together
Individual KPIs can mislead. These combinations tell you more:
| If you see… |
It may mean… |
Look at… |
| Spend under management up, cycle time up |
Controls are adding friction |
Approval steps and routing rules |
| Supplier count stable, new suppliers high |
One-off suppliers replacing old ones |
Spot buy rules and preferred supplier use |
| PO compliance up, card share down |
Small purchases pushed into the PO process |
Card policy and limits |
| Spend classified up, catch-all categories up |
Data visible but not usable |
Taxonomy and review queue |
Classification quality underpins all of these. Our guide to
AI spend classification explains how to check it.
Who Needs Which KPIs
| Audience |
KPIs to show |
How often |
| Procurement team |
All core and supporting KPIs, by category and channel |
Monthly |
| Finance and accounts payable |
PO compliance, card share, cost per PO, spend under management |
Monthly or quarterly |
| Leadership |
Spend under management, supplier count, cost per PO trend, risk coverage |
Quarterly |
| Budget holders |
Their own spend by channel and cycle time |
Quarterly |
Common Mistakes
-
- Counting savings only. In the tail, much of the value comes from fewer suppliers, lower process cost and lower risk.
-
- No baseline. Without a starting point, improvements cannot be shown.
-
- Too many KPIs. Start with four, add others only when you will act on them.
-
- Ignoring card and expense data. Much tail spend never touches a purchase order.
-
- Reporting without action. Each KPI review should end with a decision, such as a channel change, a policy tweak or a supplier consolidation.
Next step
Set your baseline. The Tail Spend Management Assessor asks four quick questions and shows where your organisation stands, a useful starting point before you set KPI targets.
Frequently Asked Questions
What is the most important tail spend KPI?
Spend under management is usually the headline KPI, because it shows how much tail spend goes through approved channels. It should always be read alongside cycle time, so that tighter control does not make buying so slow that people find workarounds.
How do you calculate spend under management?
Divide the tail spend that went through approved channels, such as catalogues, preferred suppliers, P-cards within policy and spot-buy processes, by total tail spend for the same period. Define the approved channels in advance and keep the definition fixed.
How many KPIs should a tail spend programme track?
Start with four core KPIs: spend under management, active supplier count, PO compliance and cycle time. Add supporting measures, such as cost per PO or supplier checks, only when you will use them to make decisions.
How often should tail spend KPIs be reviewed?
Procurement teams usually review them monthly, while finance and leadership review a smaller set quarterly. Recalculate the baseline whenever the tail definition or channel list changes.